Tiling survival screen tutorial
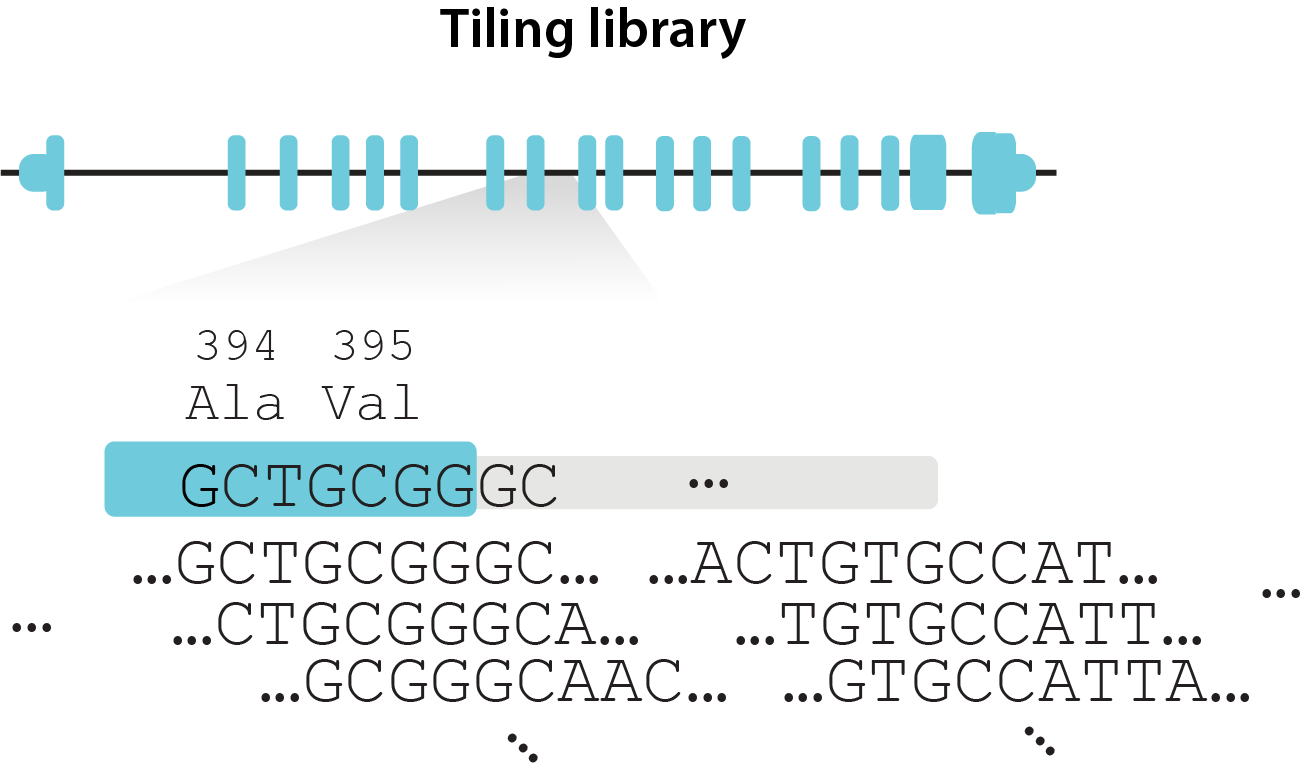
Tiling screen that tiles gRNA densely across locus or multiple loci, selected based on FACS signal quantiles. Here, we will consider an alternative read structure.
| Library design | Tiling (gRNAs tile each locus densely)  |
|---|---|
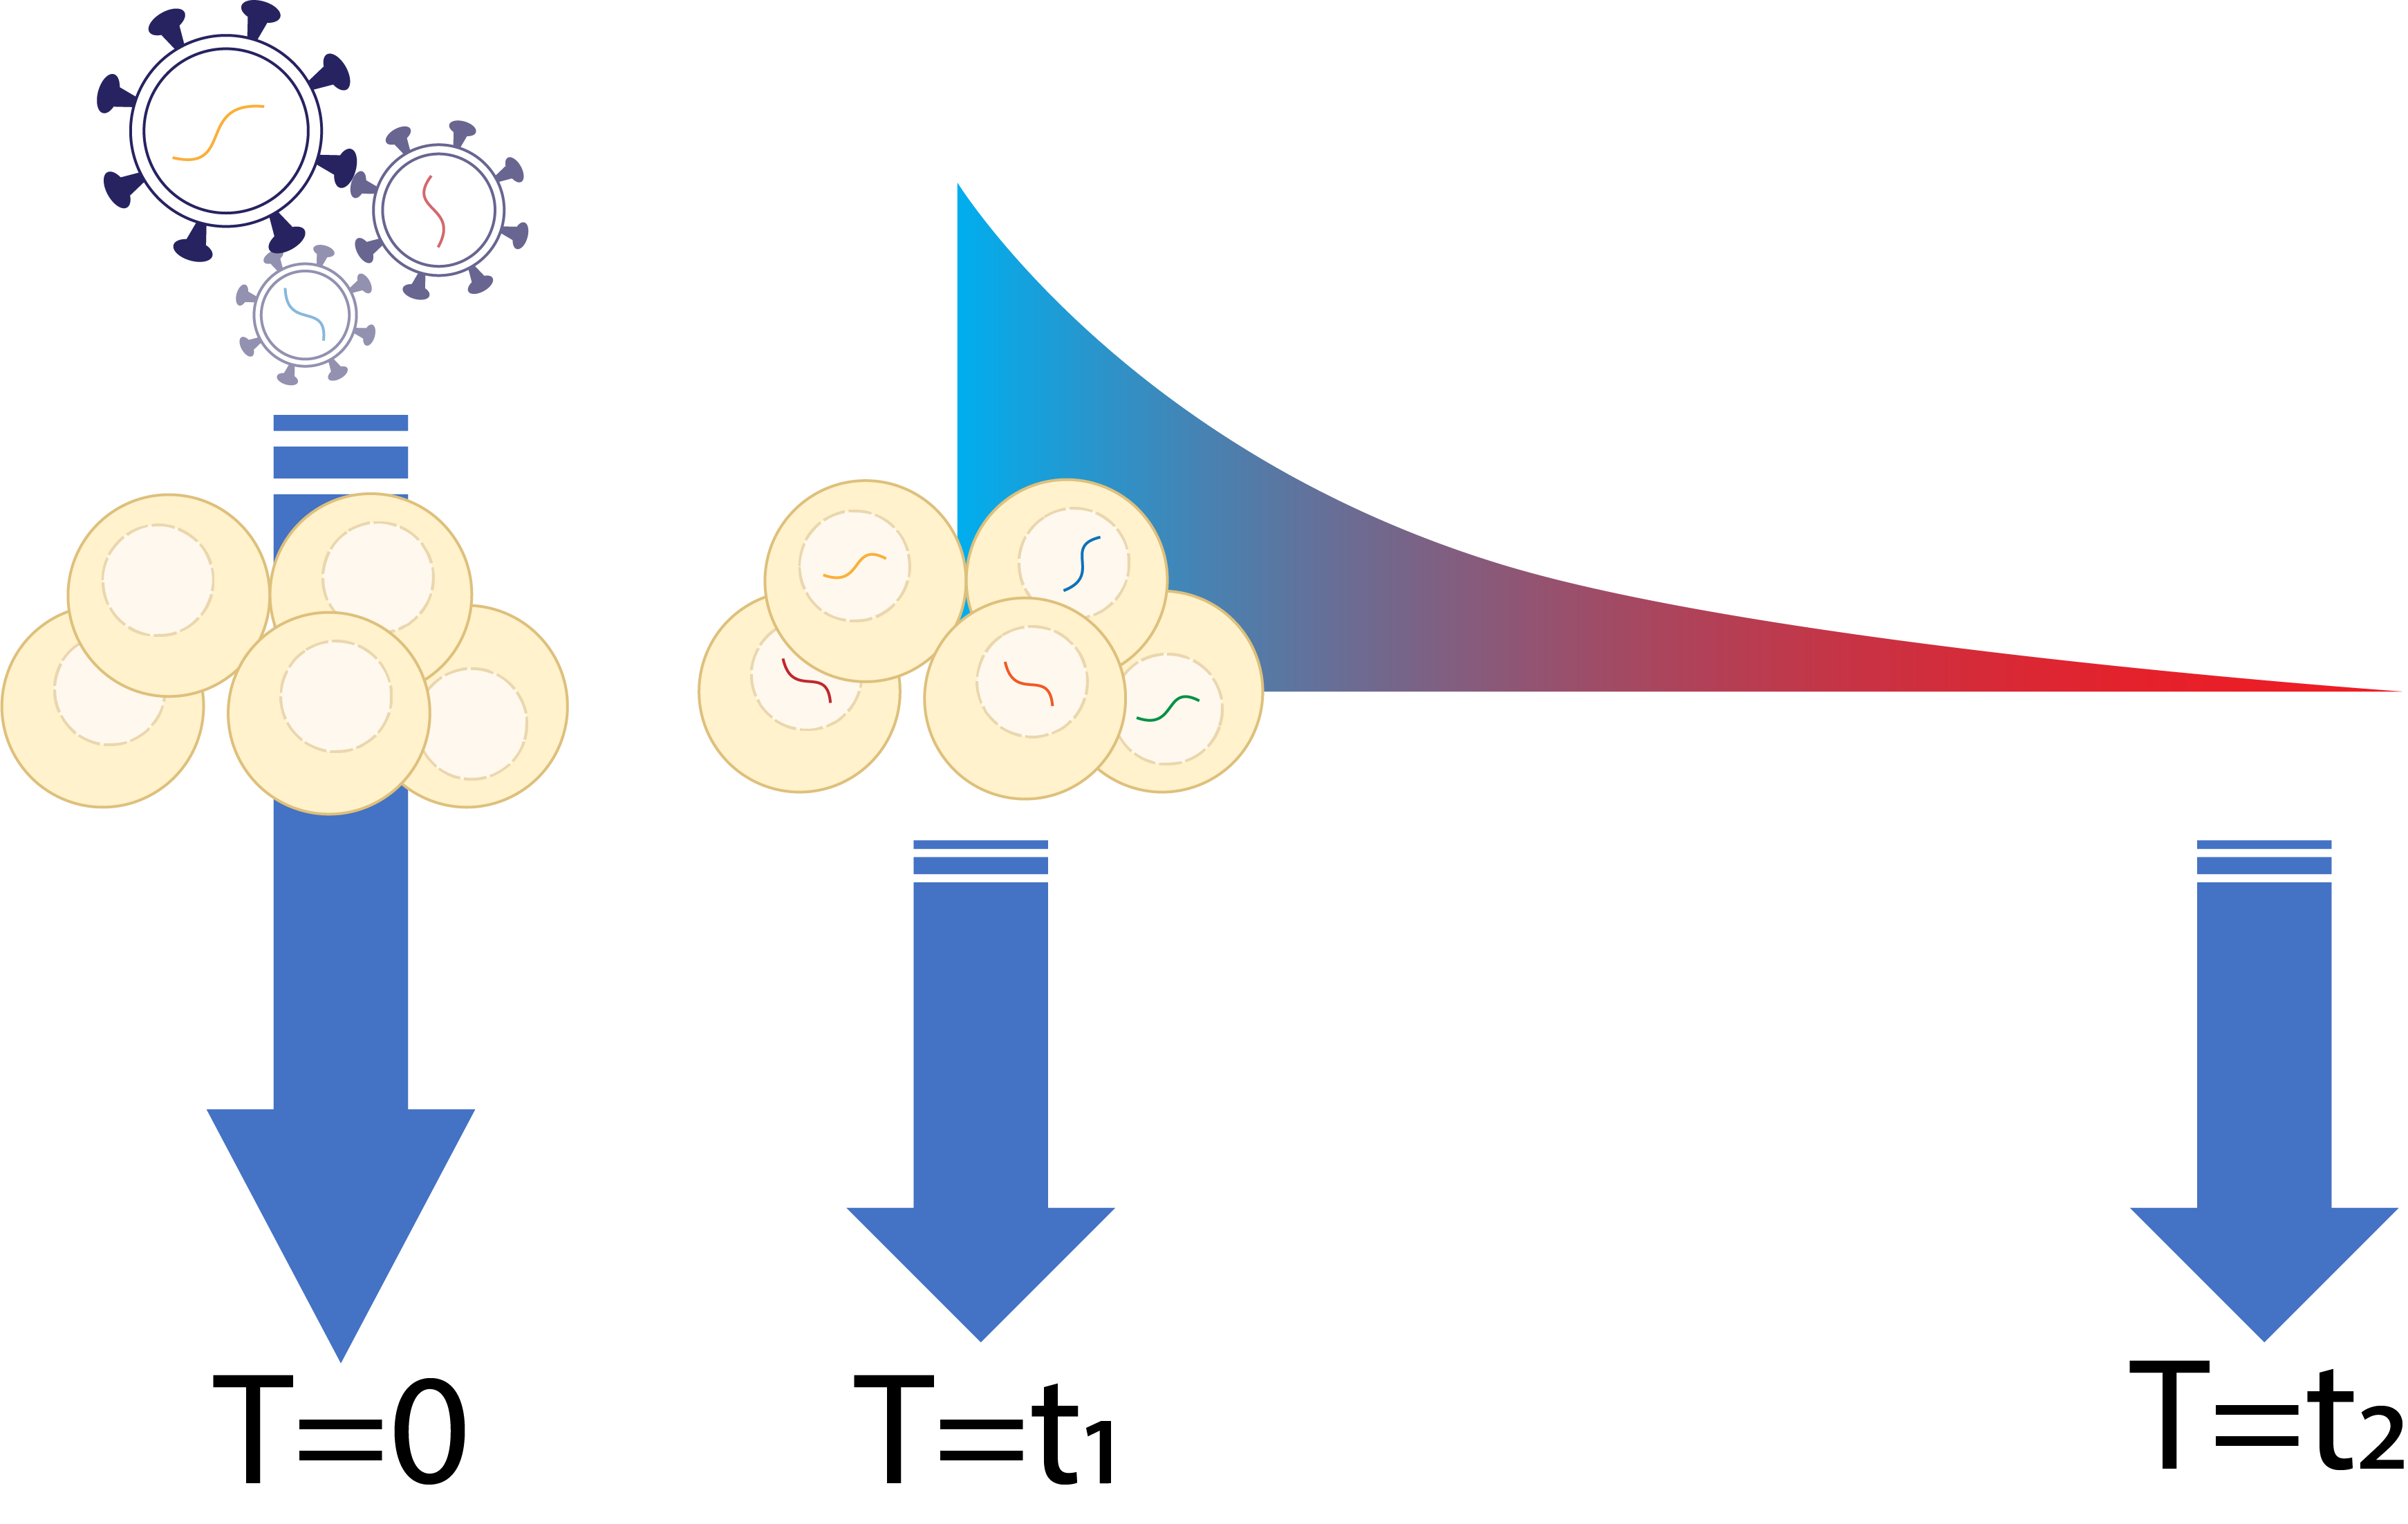
| Selection | Cells are grown and will be selected based on their fitness. Cells are sampled in multiple timepoints.  |
For this tutorial, we will consider the following experimental design where the editing rate is measured from the earliest timepoint D7, while we do want to use the initial gRNA abundance from plasmid library.
Example sample_list.csv:
R1_filepath |
R2_filepath |
sample_id |
replicate |
condition |
time |
|---|---|---|---|---|---|
rep1_plasmid_R1.fq |
rep1_plasmid_R2.fq |
rep1_plasmid |
rep1 |
plasmid |
0 |
rep1_D7 _R1.fq |
rep1_D7 _R2.fq |
rep1_D7 |
rep1 |
D7 |
7 |
rep1_D14 _R1.fq |
rep1_D14 _R2.fq |
rep1_D14 |
rep1 |
D14 |
14 |
rep2_plasmid_R1.fq |
rep2_plasmid_R2.fq |
rep2_plasmid |
rep2 |
plasmid |
0 |
rep2_D7 _R1.fq |
rep2_D7 _R2.fq |
rep2_D7 |
rep2 |
D7 |
7 |
rep2_D14 _R1.fq |
rep2_D14 _R2.fq |
rep2_D14 |
rep2 |
D14 |
14 |
Note that time column should be numeric, and condition and time should match one to one.
Example workflow
screen_id=survival_tiling_mini_screen
working_dir=tests/data/

# 1. Count gRNA & reporter
bean count-samples \
--input ${working_dir}/sample_list_survival.csv          `# Contains fastq file path; see test file for example.`\
-b A                                               `# Base A is edited (into G)` \
-f ${working_dir}/test_guide_info_tiling_chrom.csv     `# Contains gRNA metadata; see test file for example.`\
-o $working_dir                                              `# Output directory` \
-r                                                 `# Quantify reporter edits` \
-n ${screen_id}                                       `# ID of the screen` \
--tiling
# count-samples output from above test run is too low in read depth. Downstream processes can be run with test file included in the Github repo.

# (Optional) Profile editing patterns
bean profile tests/data/${screen_id}.h5ad --pam-col '5-nt PAM'


# 2. QC samples & guides
bean qc \
  ${working_dir}/${screen_id}.h5ad           `# Input ReporterScreen .h5ad file path` \
  -o ${working_dir}/${screen_id}_masked.h5ad `# Output ReporterScreen .h5ad file path` \
  -r ${working_dir}/qc_report_${screen_id}              `# Prefix for QC report` \

# 3. Filter & translate alleles
bean filter ${working_dir}/${screen_id}_masked.h5ad \
-o ${working_dir}/${screen_id}_alleleFiltered \
--filter-target-basechange                             `# Filter based on intended base changes. If -b A was provided in bean count, filters for A>G edit. If -b C was provided, filters for C>T edit.`\
--filter-window --edit-start-pos 0 --edit-end-pos 19   `# Filter based on editing window in spacer position within reporter.`\
--filter-allele-proportion 0.1 --filter-sample-proportion 0.3 `#Filter based on allele proportion larger than 0.1 in at least 0.3 (30%) of the control samples.` \
--translate --translate-genes-list ${working_dir}/gene_symbols.txt

# 4. Quantify variant effect
bean run sorting tiling \
    ${working_dir}/${screen_id}_alleleFiltered.h5ad \
    -o $working_dir \
    --fit-negctrl \
    --scale-by-acc \
    --accessibility-col accessibility
See more details below.
1. Count gRNA & reporter (bean count-samples)
bean count-samples \
--input ${working_dir}/sample_list_tiling.csv          `# Contains fastq file path; see test file for example.`\
-b A                                               `# Base A is edited (into G)` \
-f ${working_dir}/test_guide_info_tiling_chrom.csv     `# Contains gRNA metadata; see test file for example.`\
-o $working_dir                                             `# Output directory` \
-r                                                 `# Quantify reporter edits` \
-n ${screen_id}                                       `# ID of the screen` \
--tiling
Make sure you follow the input file format for seamless downstream steps. This will produce ./bean_count_${screen_id}.h5ad.
(Optional) Profile editing pattern (bean profile)
You can profile the pattern of base editing based on the allele counts.
bean profile tests/data/${screen_id}.h5ad --pam-col '5-nt PAM'
Check the editing window, and consider feeding the start/end position of the editing window with the maximal editing rate into bean qc with --edit-start-pos, --edit-end-pos arguments.
Output
Output will be written under ${working_dir}/bean_profile.${screen_id}/. See example output here.
2. QC (bean qc)
Base editing data will include QC about editing efficiency. As QC uses predefined column names and values, beware to follow the input file guideline, but you can change the parameters with the full argument list of bean qc. (Common factors you may want to tweak is --ctrl-cond=bulk and --lfc-conds=top,bot if you have different sample condition labels.)
bean qc \
  ${working_dir}/${screen_id}.h5ad           `# Input ReporterScreen .h5ad file path` \
  -o ${working_dir}/${screen_id}_masked.h5ad `# Output ReporterScreen .h5ad file path` \
  -r ${working_dir}/qc_report_${screen_id}              `# Prefix for QC report` \
  [--tiling]                          `# Not required if you have passed --tiling in counting step`
If the data does not include reporter editing data, you can provide --no-editing flag to omit the editing rate QC.
Output
Output will be written under ${working_dir}/. See example output here.
3. Filter alleles (bean filter)
As tiling library doesn’t have designated per-gRNA target variant, any base edit observed in reporter may be the candidate variant, while having too many variants with very low editing rate significantly decreases the power. Variants are filtered based on multiple criteria in bean fitler.
If the screen targets coding sequence, it’s beneficial to translate edits into coding varaints whenever possible for better power. For translation, provide --translate and one of the following:
[ --translate-gene-name GENE_SYMBOL OR
  --translate-genes-list path_to_gene_names_file.txt OR
  --translate-fasta gene_exon.fa, OR
  --translate-fastas-csv gene_exon_fas.csv]
where path_to_gene_names_file.txt has one gene symbol per line, and gene symbol uses its MANE transcript (hg38) coordinates of exons. In order to use other reference versions or transcript ID, you’ll need to feed in fasta file. See detailed formatting of fasta file.
Example allele filtering given we’re translating based on MANE transcript exons of multiple gene symbols:
bean filter ${working_dir}/${screen_id}_masked.h5ad \
-o ${working_dir}/${screen_id}_alleleFiltered \
--filter-target-basechange                             `# Filter based on intended base changes. If -b A was provided in bean count, filters for A>G edit. If -b C was provided, filters for C>T edit.`\
--filter-window --edit-start-pos 0 --edit-end-pos 19   `# Filter based on editing window in spacer position within reporter.`\
--filter-allele-proportion 0.1 --filter-sample-proportion 0.3 `#Filter based on allele proportion larger than 0.1 in at least 0.3 (30%) of the control samples.` \
--translate --translate-genes-list ${working_dir}/gene_symbols.txt
CAUTION
Ouptut file ...filtered_allele_stats.pdf shows number of alleles per guide and number of guides per variant, where we want high enough values for the latter. If your alleles get filtered too drastically, consider adjusting filtering threshold --filter-allele-proportion 0.1 --filter-sample-proportion 0.3. See the typical output for dataset with good editing coverage & filtering result.
Output
Output will be written under ${working_dir}/. See example output here.
4. Quantify variant effect (bean run)
By default, bean run [sorting,survival] tiling uses most filtered allele counts table for variant identification and quantification of their effects. Check allele filtering output and choose alternative filtered allele counts table if necessary.
bean run can take 3 run options to quantify editing rate:
From reporter + accessibility
1-1. If your gRNA metadata table (${working_dir}/test_guide_info_tiling_chrom.csvabove) included per-gRNA accessibility score,bean run sorting tiling \ ${working_dir}/${screen_id}_alleleFiltered.h5ad \ -o $working_dir \ --fit-negctrl \ --scale-by-acc \ --acc-col accessibility
1-2. If your gRNA metadata table (
${working_dir}/test_guide_info_tiling_chrom.csvabove) included per-gRNA chromosome & position and you have bigWig file with accessibility signal,bean run sorting tiling \ ${working_dir}/${screen_id}_alleleFiltered.h5ad \ -o $working_dir \ --fit-negctrl \ --scale-by-acc \ --acc-bw-path accessibility.bw
From reporter
bean run sorting tiling \
${working_dir}/${screen_id}_alleleFiltered.h5ad \
-o $working_dir \
--fit-negctrl
No reporter information, assume the same editing efficiency of all gRNAs.
Use this option if your data don’t have editing rate information.bean run sorting tiling \ ${working_dir}/${screen_id}_alleleFiltered.h5ad \ -o $working_dir \ --fit-negctrl \ --uniform-edit
Output
Output will be written under ${working_dir}/. See example output here.
See Subcommands for the full details.