Pancreas Development#
Check jupyter notebook#
[1]:
!jupyter --version
Selected Jupyter core packages...
IPython          : 8.5.0
ipykernel        : 6.15.2
ipywidgets       : 8.0.2
jupyter_client   : 7.3.5
jupyter_core     : 4.11.1
jupyter_server   : not installed
jupyterlab       : not installed
nbclient         : 0.6.7
nbconvert        : 7.0.0
nbformat         : 5.4.0
notebook         : 6.4.12
qtconsole        : not installed
traitlets        : 5.3.0
Load modules#
[2]:
%load_ext autoreload
%autoreload 2
import scvelo as scv
import numpy as np
import torch
import matplotlib.pyplot as plt
from pyrovelocity.data import load_data
from scipy.stats import spearmanr, pearsonr
from pyrovelocity.api import train_model
import seaborn as sns
import pandas as pd
from pyrovelocity.plot import plot_posterior_time, plot_gene_ranking,\
      vector_field_uncertainty, plot_vector_field_uncertain,\
      plot_mean_vector_field, project_grid_points,rainbowplot,denoised_umap,\
      us_rainbowplot, plot_arrow_examples
from pyrovelocity.utils import mae, mae_evaluate
[3]:
adata = load_data(top_n=2000, min_shared_counts=30)
computing terminal states
    identified 2 regions of root cells and 1 region of end points .
    finished (0:00:00) --> added
    'root_cells', root cells of Markov diffusion process (adata.obs)
    'end_points', end points of Markov diffusion process (adata.obs)
computing latent time using root_cells as prior
    finished (0:00:01) --> added
    'latent_time', shared time (adata.obs)
[4]:
adata
[4]:
AnnData object with n_obs × n_vars = 3696 × 2000
    obs: 'clusters_coarse', 'clusters', 'S_score', 'G2M_score', 'u_lib_size_raw', 's_lib_size_raw', 'gcs', 'cytotrace', 'counts', 'initial_size_spliced', 'initial_size_unspliced', 'initial_size', 'n_counts', 'velocity_self_transition', 'root_cells', 'end_points', 'velocity_pseudotime', 'latent_time'
    var: 'highly_variable_genes', 'cytotrace', 'cytotrace_corrs', 'gene_count_corr', 'means', 'dispersions', 'dispersions_norm', 'highly_variable', 'fit_r2', 'fit_alpha', 'fit_beta', 'fit_gamma', 'fit_t_', 'fit_scaling', 'fit_std_u', 'fit_std_s', 'fit_likelihood', 'fit_u0', 'fit_s0', 'fit_pval_steady', 'fit_steady_u', 'fit_steady_s', 'fit_variance', 'fit_alignment_scaling', 'velocity_genes'
    uns: 'clusters_coarse_colors', 'clusters_colors', 'day_colors', 'neighbors', 'pca', 'recover_dynamics', 'velocity_graph', 'velocity_graph_neg', 'velocity_params'
    obsm: 'X_pca', 'X_umap', 'velocity_umap'
    varm: 'loss'
    layers: 'Ms', 'Mu', 'fit_t', 'fit_tau', 'fit_tau_', 'raw_spliced', 'raw_unspliced', 'spliced', 'unspliced', 'velocity', 'velocity_u'
    obsp: 'connectivities', 'distances'
Apply Model 1 to training and validation cells in pancreas#
[5]:
adata_model_pos_split = train_model(adata, max_epochs=4000, svi_train=False, log_every=100,
                                    patient_init=45, batch_size=-1, use_gpu=1,
                                    include_prior=True, offset=False, library_size=True,
                                    patient_improve=1e-4, guide_type='auto_t0_constraint', train_size=0.67)
INFO     No batch_key inputted, assuming all cells are same batch
INFO     No label_key inputted, assuming all cells have same label
INFO     Using data from adata.layers["raw_unspliced"]
INFO     Using data from adata.layers["raw_spliced"]
INFO     Successfully registered anndata object containing 3696 cells, 2000 vars, 1 batches, 1 labels, and 0
         proteins. Also registered 0 extra categorical covariates and 0 extra continuous covariates.
INFO     Please do not further modify adata until model is trained.
Anndata setup with scvi-tools version 0.13.0.
              Data Summary
┏━━━━━━━━━━━━━━━━━━━━━━━━━━━━━━┳━━━━━━━┓
┃             Data             ┃ Count ┃
┡━━━━━━━━━━━━━━━━━━━━━━━━━━━━━━╇━━━━━━━┩
│            Cells             │ 3696  │
│             Vars             │ 2000  │
│            Labels            │   1   │
│           Batches            │   1   │
│           Proteins           │   0   │
│ Extra Categorical Covariates │   0   │
│ Extra Continuous Covariates  │   0   │
└──────────────────────────────┴───────┘
                 SCVI Data Registry
┏━━━━━━━━━━━━━━━━━━┳━━━━━━━━━━━━━━━━━━━━━━━━━━━━━━━┓
┃       Data       ┃      scvi-tools Location      ┃
┡━━━━━━━━━━━━━━━━━━╇━━━━━━━━━━━━━━━━━━━━━━━━━━━━━━━┩
│        X         │  adata.layers['raw_spliced']  │
│        U         │ adata.layers['raw_unspliced'] │
│      batch       │   adata.obs['_scvi_batch']    │
│      label       │   adata.obs['_scvi_labels']   │
│      ind_x       │     adata.obs['_indices']     │
│    u_lib_size    │    adata.obs['u_lib_size']    │
│    s_lib_size    │    adata.obs['s_lib_size']    │
│ u_lib_size_mean  │ adata.obs['u_lib_size_mean']  │
│ s_lib_size_mean  │ adata.obs['s_lib_size_mean']  │
│ u_lib_size_scale │ adata.obs['u_lib_size_scale'] │
│ s_lib_size_scale │ adata.obs['s_lib_size_scale'] │
│    cytotrace     │    adata.obs['cytotrace']     │
└──────────────────┴───────────────────────────────┘
                        Label Categories
┏━━━━━━━━━━━━━━━━━━━━━━━━━━━┳━━━━━━━━━━━━┳━━━━━━━━━━━━━━━━━━━━━┓
┃      Source Location      ┃ Categories ┃ scvi-tools Encoding ┃
┡━━━━━━━━━━━━━━━━━━━━━━━━━━━╇━━━━━━━━━━━━╇━━━━━━━━━━━━━━━━━━━━━┩
│ adata.obs['_scvi_labels'] │     0      │          0          │
└───────────────────────────┴────────────┴─────────────────────┘
                       Batch Categories
┏━━━━━━━━━━━━━━━━━━━━━━━━━━┳━━━━━━━━━━━━┳━━━━━━━━━━━━━━━━━━━━━┓
┃     Source Location      ┃ Categories ┃ scvi-tools Encoding ┃
┡━━━━━━━━━━━━━━━━━━━━━━━━━━╇━━━━━━━━━━━━╇━━━━━━━━━━━━━━━━━━━━━┩
│ adata.obs['_scvi_batch'] │     0      │          0          │
└──────────────────────────┴────────────┴─────────────────────┘
-----------
auto
auto_t0_constraint
step    0 loss = 9.01336e+07 patience = 45
step  100 loss = 6.57153e+07 patience = 45
step  200 loss = 5.46784e+07 patience = 45
step  300 loss = 4.53023e+07 patience = 45
step  400 loss = 3.71664e+07 patience = 45
step  500 loss = 3.00779e+07 patience = 45
step  600 loss = 2.39203e+07 patience = 45
step  700 loss = 1.87633e+07 patience = 45
step  800 loss = 1.4903e+07 patience = 45
step  900 loss = 1.24599e+07 patience = 45
step 1000 loss = 1.14886e+07 patience = 45
step 1100 loss = 1.12743e+07 patience = 45
step 1200 loss = 1.11933e+07 patience = 44
step 1300 loss = 1.11422e+07 patience = 45
step 1400 loss = 1.10905e+07 patience = 44
step 1500 loss = 1.10555e+07 patience = 44
step 1600 loss = 1.10037e+07 patience = 45
step 1700 loss = 1.0964e+07 patience = 45
step 1800 loss = 1.09394e+07 patience = 45
step 1900 loss = 1.09002e+07 patience = 44
step 2000 loss = 1.08785e+07 patience = 44
step 2100 loss = 1.08635e+07 patience = 45
step 2200 loss = 1.08321e+07 patience = 44
step 2300 loss = 1.07795e+07 patience = 43
step 2400 loss = 1.07716e+07 patience = 45
step 2500 loss = 1.07376e+07 patience = 44
step 2600 loss = 1.07266e+07 patience = 43
step 2700 loss = 1.06973e+07 patience = 44
step 2800 loss = 1.06726e+07 patience = 45
step 2900 loss = 1.06609e+07 patience = 45
step 3000 loss = 1.0636e+07 patience = 43
step 3100 loss = 1.063e+07 patience = 45
step 3200 loss = 1.0616e+07 patience = 45
step 3300 loss = 1.05937e+07 patience = 45
step 3400 loss = 1.05874e+07 patience = 44
step 3500 loss = 1.0573e+07 patience = 44
step 3600 loss = 1.05605e+07 patience = 45
step 3700 loss = 1.05539e+07 patience = 44
step 3800 loss = 1.05497e+07 patience = 45
step 3900 loss = 1.05381e+07 patience = 45
step    0 loss = 7.7221e+07 patience = 45
step  100 loss = 6.60951e+07 patience = 45
step  200 loss = 5.30222e+07 patience = 45
step  300 loss = 4.2366e+07 patience = 45
step  400 loss = 3.47616e+07 patience = 45
step  500 loss = 2.8177e+07 patience = 45
step  600 loss = 2.23558e+07 patience = 45
step  700 loss = 1.75254e+07 patience = 45
step  800 loss = 1.38981e+07 patience = 44
step  900 loss = 1.16718e+07 patience = 45
step 1000 loss = 1.08245e+07 patience = 45
step 1100 loss = 1.06958e+07 patience = 44
step 1200 loss = 1.06888e+07 patience = 42
step 1300 loss = 1.06772e+07 patience = 45
step 1400 loss = 1.06724e+07 patience = 44
step 1500 loss = 1.06934e+07 patience = 43
step 1600 loss = 1.06836e+07 patience = 44
step 1700 loss = 1.06786e+07 patience = 43
step 1800 loss = 1.06688e+07 patience = 45
step 1900 loss = 1.06689e+07 patience = 45
step 2000 loss = 1.06766e+07 patience = 44
step 2100 loss = 1.06678e+07 patience = 44
step 2200 loss = 1.06633e+07 patience = 44
step 2300 loss = 1.06727e+07 patience = 43
step 2400 loss = 1.06746e+07 patience = 45
step 2500 loss = 1.06747e+07 patience = 45
step 2600 loss = 1.06674e+07 patience = 45
step 2700 loss = 1.06826e+07 patience = 45
step 2800 loss = 1.0684e+07 patience = 45
step 2900 loss = 1.06752e+07 patience = 45
step 3000 loss = 1.06866e+07 patience = 45
step 3100 loss = 1.06716e+07 patience = 44
step 3200 loss = 1.06765e+07 patience = 44
step 3300 loss = 1.06729e+07 patience = 44
step 3400 loss = 1.0671e+07 patience = 43
step 3500 loss = 1.06694e+07 patience = 43
step 3600 loss = 1.06738e+07 patience = 45
step 3700 loss = 1.06719e+07 patience = 43
step 3800 loss = 1.06666e+07 patience = 45
step 3900 loss = 1.06615e+07 patience = 44
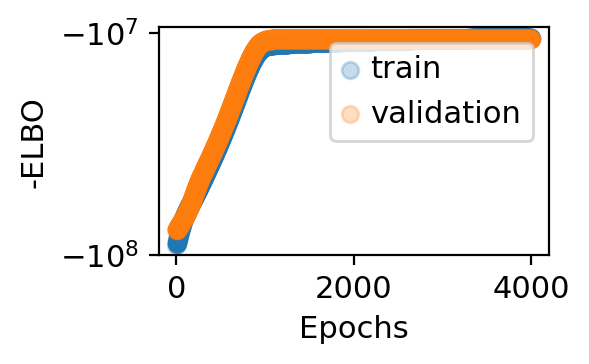
[6]:
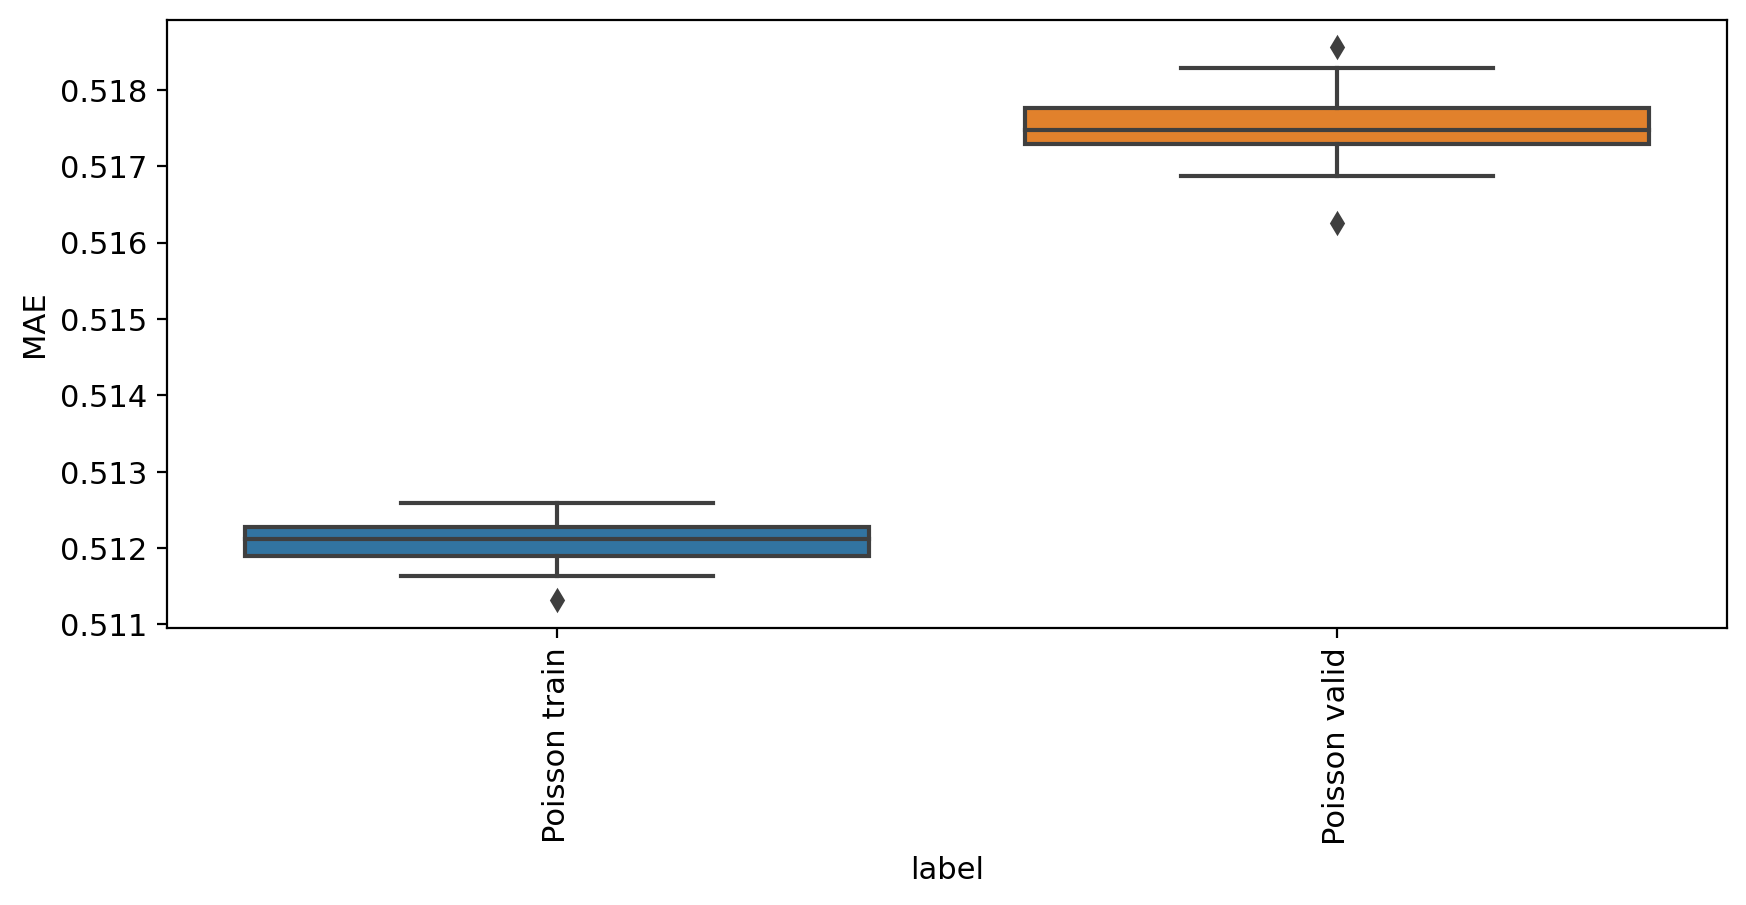
mae_evaluate(adata_model_pos_split, adata)
                    MAE
label
Poisson train  0.512080
Poisson valid  0.517524
[6]:
| MAE | label | |
|---|---|---|
| 0 | 0.511755 | Poisson train |
| 1 | 0.512193 | Poisson train |
| 2 | 0.511711 | Poisson train |
| 3 | 0.512358 | Poisson train |
| 4 | 0.512323 | Poisson train |
| 5 | 0.511926 | Poisson train |
| 6 | 0.512204 | Poisson train |
| 7 | 0.512150 | Poisson train |
| 8 | 0.511319 | Poisson train |
| 9 | 0.512367 | Poisson train |
| 10 | 0.511900 | Poisson train |
| 11 | 0.512199 | Poisson train |
| 12 | 0.512356 | Poisson train |
| 13 | 0.511779 | Poisson train |
| 14 | 0.511862 | Poisson train |
| 15 | 0.512525 | Poisson train |
| 16 | 0.512086 | Poisson train |
| 17 | 0.512188 | Poisson train |
| 18 | 0.512236 | Poisson train |
| 19 | 0.511944 | Poisson train |
| 20 | 0.511909 | Poisson train |
| 21 | 0.512078 | Poisson train |
| 22 | 0.512152 | Poisson train |
| 23 | 0.511633 | Poisson train |
| 24 | 0.512519 | Poisson train |
| 25 | 0.511670 | Poisson train |
| 26 | 0.512293 | Poisson train |
| 27 | 0.512586 | Poisson train |
| 28 | 0.512095 | Poisson train |
| 29 | 0.512077 | Poisson train |
| 30 | 0.517198 | Poisson valid |
| 31 | 0.517522 | Poisson valid |
| 32 | 0.517989 | Poisson valid |
| 33 | 0.517068 | Poisson valid |
| 34 | 0.517412 | Poisson valid |
| 35 | 0.517462 | Poisson valid |
| 36 | 0.518282 | Poisson valid |
| 37 | 0.517553 | Poisson valid |
| 38 | 0.517354 | Poisson valid |
| 39 | 0.517864 | Poisson valid |
| 40 | 0.518068 | Poisson valid |
| 41 | 0.517492 | Poisson valid |
| 42 | 0.517699 | Poisson valid |
| 43 | 0.517316 | Poisson valid |
| 44 | 0.517906 | Poisson valid |
| 45 | 0.516879 | Poisson valid |
| 46 | 0.517620 | Poisson valid |
| 47 | 0.517216 | Poisson valid |
| 48 | 0.517398 | Poisson valid |
| 49 | 0.517490 | Poisson valid |
| 50 | 0.518559 | Poisson valid |
| 51 | 0.517740 | Poisson valid |
| 52 | 0.517169 | Poisson valid |
| 53 | 0.517467 | Poisson valid |
| 54 | 0.518061 | Poisson valid |
| 55 | 0.517774 | Poisson valid |
| 56 | 0.517445 | Poisson valid |
| 57 | 0.517291 | Poisson valid |
| 58 | 0.517156 | Poisson valid |
| 59 | 0.516258 | Poisson valid |
Apply Model 1 to all cells#
[7]:
adata_model_pos = train_model(adata, max_epochs=4000, svi_train=False, log_every=100,
                              patient_init=45, batch_size=-1, use_gpu=0,
                              include_prior=True, offset=False, library_size=True,
                              patient_improve=1e-4, guide_type='auto_t0_constraint', train_size=1.0)
INFO No batch_key inputted, assuming all cells are same batch
INFO:scvi.data._anndata:No batch_key inputted, assuming all cells are same batch
INFO No label_key inputted, assuming all cells have same label
INFO:scvi.data._anndata:No label_key inputted, assuming all cells have same label
INFO Using data from adata.layers["raw_unspliced"]
INFO:scvi.data._anndata:Using data from adata.layers["raw_unspliced"]
INFO Using data from adata.layers["raw_spliced"]
INFO:scvi.data._anndata:Using data from adata.layers["raw_spliced"]
INFO     Successfully registered anndata object containing 3696 cells, 2000 vars, 1 batches, 1 labels, and 0
         proteins. Also registered 0 extra categorical covariates and 0 extra continuous covariates.
INFO:scvi.data._anndata:Successfully registered anndata object containing 3696 cells, 2000 vars, 1 batches, 1 labels, and 0 proteins. Also registered 0 extra categorical covariates and 0 extra continuous covariates.
INFO Please do not further modify adata until model is trained.
INFO:scvi.data._anndata:Please do not further modify adata until model is trained.
Anndata setup with scvi-tools version 0.13.0.
              Data Summary
┏━━━━━━━━━━━━━━━━━━━━━━━━━━━━━━┳━━━━━━━┓
┃             Data             ┃ Count ┃
┡━━━━━━━━━━━━━━━━━━━━━━━━━━━━━━╇━━━━━━━┩
│            Cells             │ 3696  │
│             Vars             │ 2000  │
│            Labels            │   1   │
│           Batches            │   1   │
│           Proteins           │   0   │
│ Extra Categorical Covariates │   0   │
│ Extra Continuous Covariates  │   0   │
└──────────────────────────────┴───────┘
                 SCVI Data Registry
┏━━━━━━━━━━━━━━━━━━┳━━━━━━━━━━━━━━━━━━━━━━━━━━━━━━━┓
┃       Data       ┃      scvi-tools Location      ┃
┡━━━━━━━━━━━━━━━━━━╇━━━━━━━━━━━━━━━━━━━━━━━━━━━━━━━┩
│        X         │  adata.layers['raw_spliced']  │
│        U         │ adata.layers['raw_unspliced'] │
│      batch       │   adata.obs['_scvi_batch']    │
│      label       │   adata.obs['_scvi_labels']   │
│      ind_x       │     adata.obs['_indices']     │
│    u_lib_size    │    adata.obs['u_lib_size']    │
│    s_lib_size    │    adata.obs['s_lib_size']    │
│ u_lib_size_mean  │ adata.obs['u_lib_size_mean']  │
│ s_lib_size_mean  │ adata.obs['s_lib_size_mean']  │
│ u_lib_size_scale │ adata.obs['u_lib_size_scale'] │
│ s_lib_size_scale │ adata.obs['s_lib_size_scale'] │
│    cytotrace     │    adata.obs['cytotrace']     │
└──────────────────┴───────────────────────────────┘
                        Label Categories
┏━━━━━━━━━━━━━━━━━━━━━━━━━━━┳━━━━━━━━━━━━┳━━━━━━━━━━━━━━━━━━━━━┓
┃      Source Location      ┃ Categories ┃ scvi-tools Encoding ┃
┡━━━━━━━━━━━━━━━━━━━━━━━━━━━╇━━━━━━━━━━━━╇━━━━━━━━━━━━━━━━━━━━━┩
│ adata.obs['_scvi_labels'] │     0      │          0          │
└───────────────────────────┴────────────┴─────────────────────┘
                       Batch Categories
┏━━━━━━━━━━━━━━━━━━━━━━━━━━┳━━━━━━━━━━━━┳━━━━━━━━━━━━━━━━━━━━━┓
┃     Source Location      ┃ Categories ┃ scvi-tools Encoding ┃
┡━━━━━━━━━━━━━━━━━━━━━━━━━━╇━━━━━━━━━━━━╇━━━━━━━━━━━━━━━━━━━━━┩
│ adata.obs['_scvi_batch'] │     0      │          0          │
└──────────────────────────┴────────────┴─────────────────────┘
-----------
auto
auto_t0_constraint
TraceEnum
step    0 loss = 6.0886 patience = 45
step  100 loss = 4.43704 patience = 45
step  200 loss = 3.68965 patience = 45
step  300 loss = 3.05238 patience = 45
step  400 loss = 2.5054 patience = 45
step  500 loss = 2.02754 patience = 45
step  600 loss = 1.61279 patience = 45
step  700 loss = 1.26498 patience = 45
step  800 loss = 1.00527 patience = 45
step  900 loss = 0.841162 patience = 45
step 1000 loss = 0.775899 patience = 45
step 1100 loss = 0.761546 patience = 45
step 1200 loss = 0.755562 patience = 45
step 1300 loss = 0.751937 patience = 45
step 1400 loss = 0.748457 patience = 44
step 1500 loss = 0.745993 patience = 44
step 1600 loss = 0.741952 patience = 44
step 1700 loss = 0.739086 patience = 45
step 1800 loss = 0.73718 patience = 44
step 1900 loss = 0.734106 patience = 44
step 2000 loss = 0.732198 patience = 41
step 2100 loss = 0.730901 patience = 45
step 2200 loss = 0.72865 patience = 44
step 2300 loss = 0.724907 patience = 43
step 2400 loss = 0.724161 patience = 45
step 2500 loss = 0.721974 patience = 45
step 2600 loss = 0.721013 patience = 45
step 2700 loss = 0.719335 patience = 44
step 2800 loss = 0.71783 patience = 37
step 2900 loss = 0.716602 patience = 45
step 3000 loss = 0.715379 patience = 44
step 3100 loss = 0.714952 patience = 45
step 3200 loss = 0.714131 patience = 45
step 3300 loss = 0.712533 patience = 41
step 3400 loss = 0.712411 patience = 44
step 3500 loss = 0.711733 patience = 44
step 3600 loss = 0.710933 patience = 44
step 3700 loss = 0.710209 patience = 44
step 3800 loss = 0.710048 patience = 45
step 3900 loss = 0.70982 patience = 45
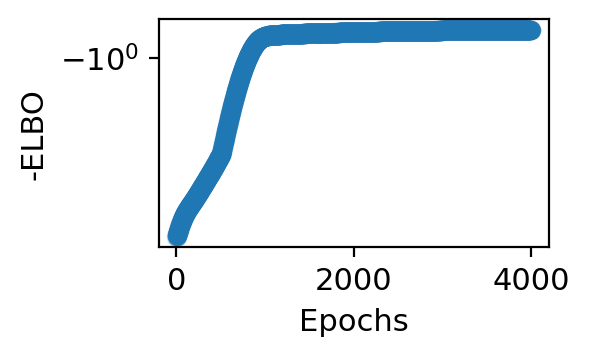
[8]:
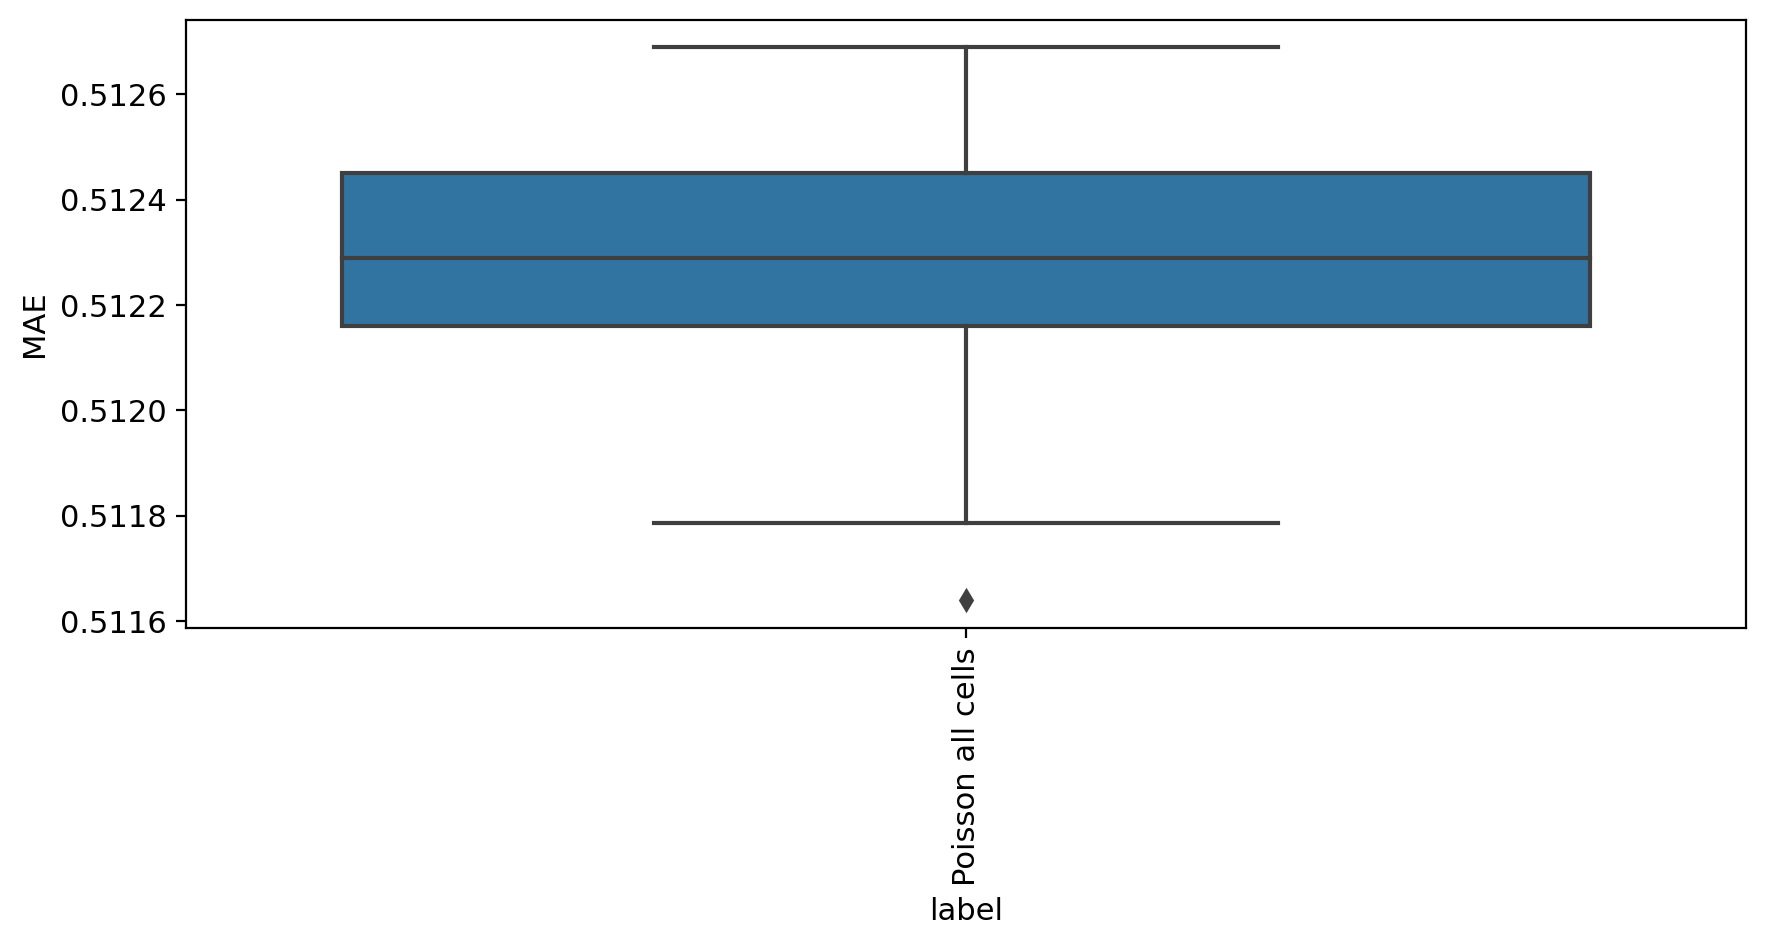
mae_evaluate(adata_model_pos[1], adata)
                        MAE
label
Poisson all cells  0.512289
[8]:
| MAE | label | |
|---|---|---|
| 0 | 0.512249 | Poisson all cells |
| 1 | 0.512128 | Poisson all cells |
| 2 | 0.512294 | Poisson all cells |
| 3 | 0.512348 | Poisson all cells |
| 4 | 0.512621 | Poisson all cells |
| 5 | 0.512312 | Poisson all cells |
| 6 | 0.512039 | Poisson all cells |
| 7 | 0.512519 | Poisson all cells |
| 8 | 0.511786 | Poisson all cells |
| 9 | 0.512624 | Poisson all cells |
| 10 | 0.511988 | Poisson all cells |
| 11 | 0.512481 | Poisson all cells |
| 12 | 0.512675 | Poisson all cells |
| 13 | 0.512297 | Poisson all cells |
| 14 | 0.512313 | Poisson all cells |
| 15 | 0.512462 | Poisson all cells |
| 16 | 0.512279 | Poisson all cells |
| 17 | 0.512133 | Poisson all cells |
| 18 | 0.512553 | Poisson all cells |
| 19 | 0.512284 | Poisson all cells |
| 20 | 0.512034 | Poisson all cells |
| 21 | 0.512272 | Poisson all cells |
| 22 | 0.512102 | Poisson all cells |
| 23 | 0.511640 | Poisson all cells |
| 24 | 0.512689 | Poisson all cells |
| 25 | 0.512353 | Poisson all cells |
| 26 | 0.512266 | Poisson all cells |
| 27 | 0.512414 | Poisson all cells |
| 28 | 0.512240 | Poisson all cells |
| 29 | 0.512279 | Poisson all cells |
[9]:
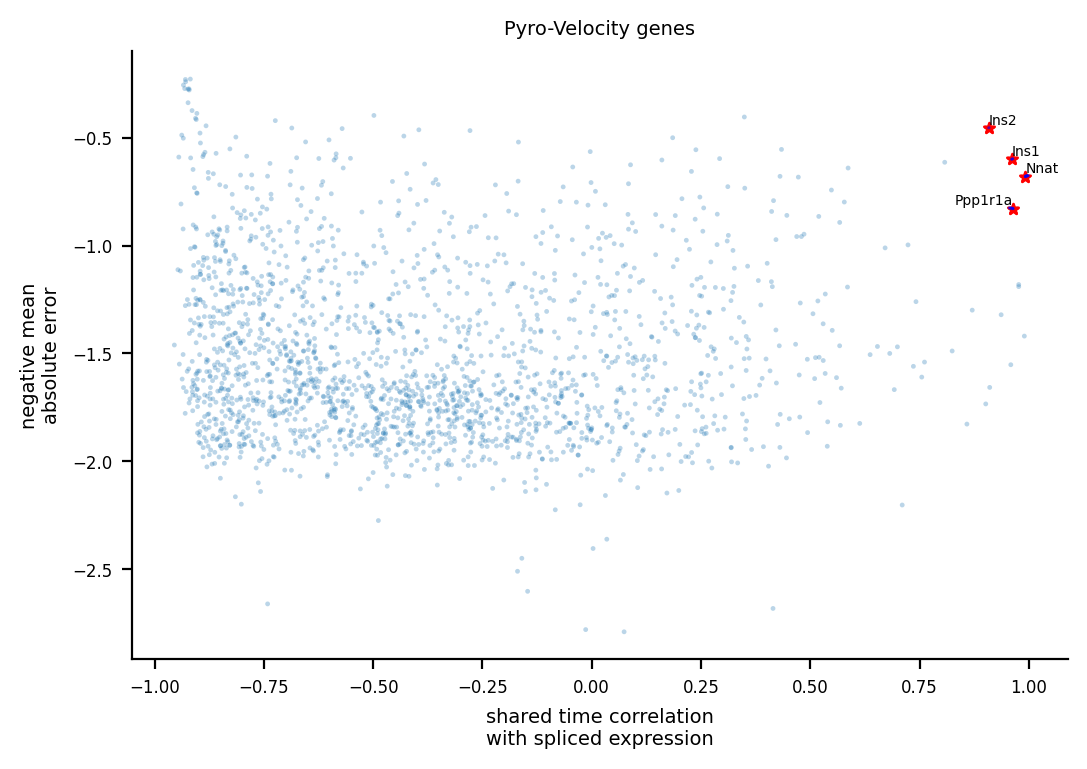
fig, ax = plt.subplots()
volcano_data, _ = plot_gene_ranking([adata_model_pos[1]], [adata], ax=ax, time_correlation_with='st')
[10]:
v_map_all, embeds_radian, fdri = vector_field_uncertainty(adata, adata_model_pos[1], basis='umap', n_jobs=10)
computing neighbors
    finished (0:00:02) --> added
    'distances' and 'connectivities', weighted adjacency matrices (adata.obsp)
computing velocity graph (using 10/256 cores)
    finished (0:00:11) --> added
    'velocity_pyro_graph', sparse matrix with cosine correlations (adata.uns)
computing velocity embedding
    finished (0:00:00) --> added
    'velocity_pyro_umap', embedded velocity vectors (adata.obsm)
computing velocity graph (using 10/256 cores)
    finished (0:00:05) --> added
    'velocity_pyro_graph', sparse matrix with cosine correlations (adata.uns)
computing velocity embedding
    finished (0:00:00) --> added
    'velocity_pyro_umap', embedded velocity vectors (adata.obsm)
computing velocity graph (using 10/256 cores)
    finished (0:00:04) --> added
    'velocity_pyro_graph', sparse matrix with cosine correlations (adata.uns)
computing velocity embedding
    finished (0:00:00) --> added
    'velocity_pyro_umap', embedded velocity vectors (adata.obsm)
computing velocity graph (using 10/256 cores)
    finished (0:00:04) --> added
    'velocity_pyro_graph', sparse matrix with cosine correlations (adata.uns)
computing velocity embedding
    finished (0:00:00) --> added
    'velocity_pyro_umap', embedded velocity vectors (adata.obsm)
computing velocity graph (using 10/256 cores)
    finished (0:00:04) --> added
    'velocity_pyro_graph', sparse matrix with cosine correlations (adata.uns)
computing velocity embedding
    finished (0:00:00) --> added
    'velocity_pyro_umap', embedded velocity vectors (adata.obsm)
computing velocity graph (using 10/256 cores)
    finished (0:00:04) --> added
    'velocity_pyro_graph', sparse matrix with cosine correlations (adata.uns)
computing velocity embedding
    finished (0:00:00) --> added
    'velocity_pyro_umap', embedded velocity vectors (adata.obsm)
computing velocity graph (using 10/256 cores)
    finished (0:00:04) --> added
    'velocity_pyro_graph', sparse matrix with cosine correlations (adata.uns)
computing velocity embedding
    finished (0:00:00) --> added
    'velocity_pyro_umap', embedded velocity vectors (adata.obsm)
computing velocity graph (using 10/256 cores)
    finished (0:00:04) --> added
    'velocity_pyro_graph', sparse matrix with cosine correlations (adata.uns)
computing velocity embedding
    finished (0:00:00) --> added
    'velocity_pyro_umap', embedded velocity vectors (adata.obsm)
computing velocity graph (using 10/256 cores)
    finished (0:00:04) --> added
    'velocity_pyro_graph', sparse matrix with cosine correlations (adata.uns)
computing velocity embedding
    finished (0:00:00) --> added
    'velocity_pyro_umap', embedded velocity vectors (adata.obsm)
computing velocity graph (using 10/256 cores)
    finished (0:00:04) --> added
    'velocity_pyro_graph', sparse matrix with cosine correlations (adata.uns)
computing velocity embedding
    finished (0:00:00) --> added
    'velocity_pyro_umap', embedded velocity vectors (adata.obsm)
computing velocity graph (using 10/256 cores)
finished (0:00:04) --> added
'velocity_pyro_graph', sparse matrix with cosine correlations (adata.uns)
computing velocity embedding
finished (0:00:00) --> added
'velocity_pyro_umap', embedded velocity vectors (adata.obsm)
computing velocity graph (using 10/256 cores)
finished (0:00:04) --> added
'velocity_pyro_graph', sparse matrix with cosine correlations (adata.uns)
computing velocity embedding
finished (0:00:00) --> added
'velocity_pyro_umap', embedded velocity vectors (adata.obsm)
computing velocity graph (using 10/256 cores)
finished (0:00:04) --> added
'velocity_pyro_graph', sparse matrix with cosine correlations (adata.uns)
computing velocity embedding
finished (0:00:00) --> added
'velocity_pyro_umap', embedded velocity vectors (adata.obsm)
computing velocity graph (using 10/256 cores)
    finished (0:00:05) --> added
    'velocity_pyro_graph', sparse matrix with cosine correlations (adata.uns)
computing velocity embedding
    finished (0:00:00) --> added
    'velocity_pyro_umap', embedded velocity vectors (adata.obsm)
computing velocity graph (using 10/256 cores)
    finished (0:00:04) --> added
    'velocity_pyro_graph', sparse matrix with cosine correlations (adata.uns)
computing velocity embedding
    finished (0:00:00) --> added
    'velocity_pyro_umap', embedded velocity vectors (adata.obsm)
computing velocity graph (using 10/256 cores)
    finished (0:00:04) --> added
    'velocity_pyro_graph', sparse matrix with cosine correlations (adata.uns)
computing velocity embedding
    finished (0:00:00) --> added
    'velocity_pyro_umap', embedded velocity vectors (adata.obsm)
computing velocity graph (using 10/256 cores)
    finished (0:00:04) --> added
    'velocity_pyro_graph', sparse matrix with cosine correlations (adata.uns)
computing velocity embedding
    finished (0:00:00) --> added
    'velocity_pyro_umap', embedded velocity vectors (adata.obsm)
computing velocity graph (using 10/256 cores)
    finished (0:00:04) --> added
    'velocity_pyro_graph', sparse matrix with cosine correlations (adata.uns)
computing velocity embedding
    finished (0:00:00) --> added
    'velocity_pyro_umap', embedded velocity vectors (adata.obsm)
computing velocity graph (using 10/256 cores)
    finished (0:00:04) --> added
    'velocity_pyro_graph', sparse matrix with cosine correlations (adata.uns)
computing velocity embedding
    finished (0:00:00) --> added
    'velocity_pyro_umap', embedded velocity vectors (adata.obsm)
computing velocity graph (using 10/256 cores)
    finished (0:00:04) --> added
    'velocity_pyro_graph', sparse matrix with cosine correlations (adata.uns)
computing velocity embedding
    finished (0:00:00) --> added
    'velocity_pyro_umap', embedded velocity vectors (adata.obsm)
computing velocity graph (using 10/256 cores)
    finished (0:00:04) --> added
    'velocity_pyro_graph', sparse matrix with cosine correlations (adata.uns)
computing velocity embedding
    finished (0:00:00) --> added
    'velocity_pyro_umap', embedded velocity vectors (adata.obsm)
[11]:
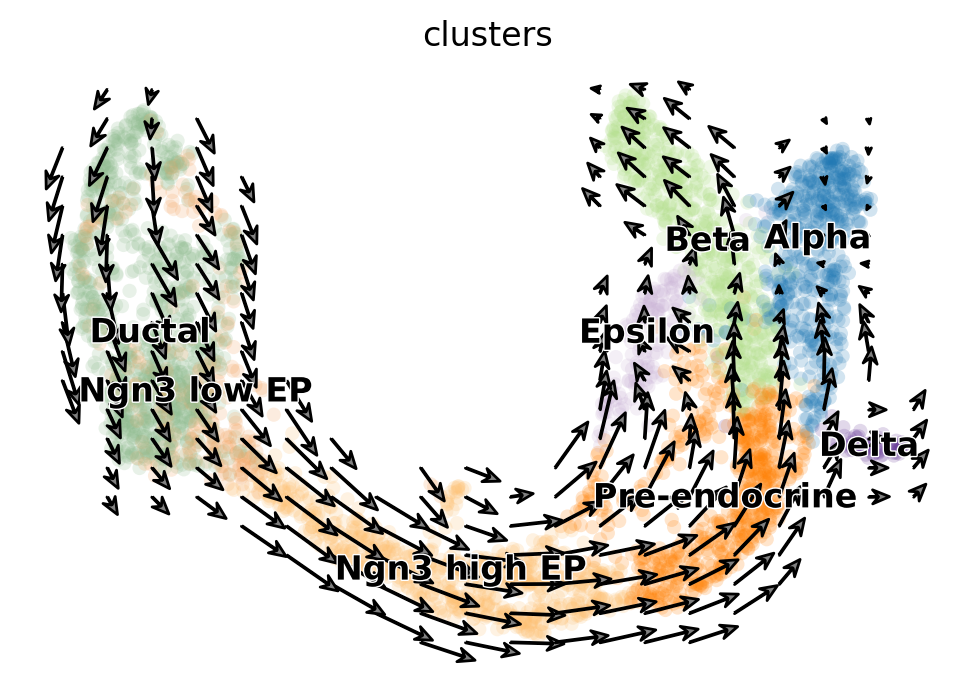
fig, ax = plt.subplots()
embed_mean = plot_mean_vector_field(adata_model_pos[1], adata, ax=ax, n_jobs=10)
computing neighbors
    finished (0:00:00) --> added
    'distances' and 'connectivities', weighted adjacency matrices (adata.obsp)
computing velocity graph (using 10/256 cores)
    finished (0:00:03) --> added
    'velocity_pyro_graph', sparse matrix with cosine correlations (adata.uns)
computing velocity embedding
    finished (0:00:00) --> added
    'velocity_pyro_umap', embedded velocity vectors (adata.obsm)
Assemble figure#
[12]:
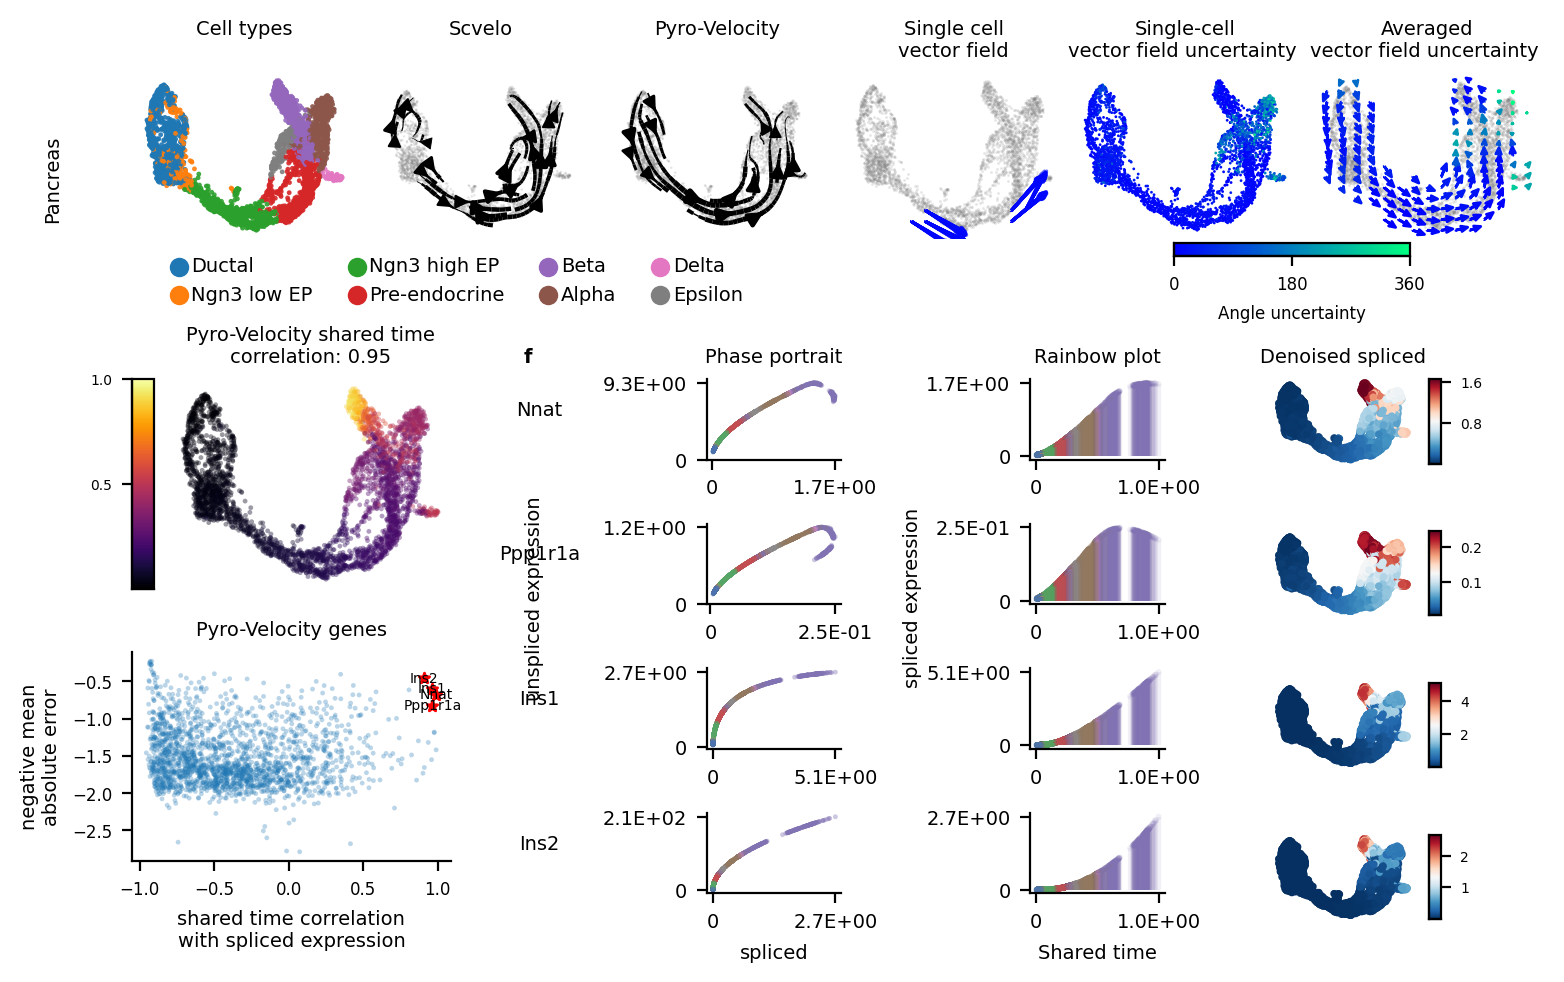
fig = plt.figure(figsize=(7.07, 4.5))
subfig_A = fig.subfigures(2, 1, wspace=0.0, hspace=0, height_ratios=[1.2, 3])
dot_size = 3
font_size = 7

ress = pd.DataFrame({"cell_type": adata.obs['clusters'].values,
                     "X1": adata.obsm['X_umap'][:,0],
                     "X2": adata.obsm['X_umap'][:,1]})
subfig_A0 = subfig_A[0].subfigures(1, 2, wspace=0.0, hspace=0, width_ratios=[4, 2])

ax = subfig_A0[0].subplots(1, 4)
sns.scatterplot(x='X1', y='X2', data=ress, alpha=0.9, s=dot_size,
                linewidth=0, edgecolor="none", hue='cell_type',
                ax=ax[0], legend='brief')
ax[0].axis('off')
ax[0].set_title("Cell types\n", fontsize=font_size)
ax[0].legend(bbox_to_anchor=[2.9, -0.01], ncol=4, prop={'size': font_size}, fontsize=font_size, frameon=False)
kwargs = dict(color='gray', density=.8, add_margin=.1, s=dot_size,
              show=False, alpha=.2, min_mass=3.5, frameon=False)
scv.pl.velocity_embedding_stream(adata, fontsize=font_size, ax=ax[1], title='', **kwargs)
ax[1].set_title("Scvelo\n", fontsize=7)

scv.pl.velocity_embedding_stream(adata, fontsize=font_size, basis='umap',
                                 title='', ax=ax[2], vkey='velocity_pyro', **kwargs)
ax[2].set_title("Pyro-Velocity\n", fontsize=7)

# plot_arrow_examples(adata_train, np.transpose(v_map_all, (1, 2, 0)), embeds_radian, ax=ax[3],
#                     n_sample=30, fig=fig, basis='umap', scale=0.004, alpha=0.18)
plot_arrow_examples(adata, np.transpose(v_map_all, (1, 2, 0)), embeds_radian, ax=ax[3],
                    n_sample=30, fig=fig, basis='umap', scale=0.008, alpha=0.2, index=5,
                    scale2=0.015, num_certain=6)
ax[3].set_title("Single cell\nvector field", fontsize=7)

plot_vector_field_uncertain(adata, embed_mean, embeds_radian,
                            fig=subfig_A0[1], cbar=True, basis='umap', scale=0.05)

subfig_A0[0].subplots_adjust(hspace=0.2, wspace=0.1, left=0.01, right=0.99, top=0.99, bottom=0.35)
subfig_A0[1].subplots_adjust(hspace=0.2, wspace=0.1, left=0.01, right=0.99, top=0.99, bottom=0.35)

subfig_A[0].text(-0.06, 0.58, "Pancreas", size=7, rotation="vertical", va="center")

subfig_B = subfig_A[1].subfigures(1, 2, wspace=0.0, hspace=0, width_ratios=[1.6, 4])
##subfig_B[0].subplots_adjust(hspace=0.2, wspace=0.1, left=0.01, right=0.99, top=0.99, bottom=0.1)

ax = subfig_B[0].subplots(2, 1)
plot_posterior_time(adata_model_pos[1], adata, ax=ax[0], fig=subfig_B[0], addition=False)
subfig_B[0].subplots_adjust(hspace=0.3, wspace=0.1, left=0.01, right=0.8, top=0.92, bottom=0.17)

volcano_data2, _ = plot_gene_ranking([adata_model_pos[1]], [adata], ax=ax[1],
                                    time_correlation_with='st', assemble=True)
_ = rainbowplot(volcano_data2, adata, adata_model_pos[1], subfig_B[1], data=['st', 'ut'], num_genes=4)
V_grid.........
V_grid.........
60 50 40
0.0
SpearmanrResult(correlation=0.9495828538437237, pvalue=0.0)
Nnat
[ 9.455868   1.4856936  9.129604  ...  1.6113306 15.078645  10.98976  ]
Ppp1r1a
[ 9.455868   1.4856936  9.129604  ...  1.6113306 15.078645  10.98976  ]
Ins1
[ 9.455868   1.4856936  9.129604  ...  1.6113306 15.078645  10.98976  ]
Ins2
[ 9.455868   1.4856936  9.129604  ...  1.6113306 15.078645  10.98976  ]
[13]:
fig.savefig("pancreas_output_figure1.tif", facecolor=fig.get_facecolor(), bbox_inches='tight', edgecolor='none', dpi=300)
[14]:
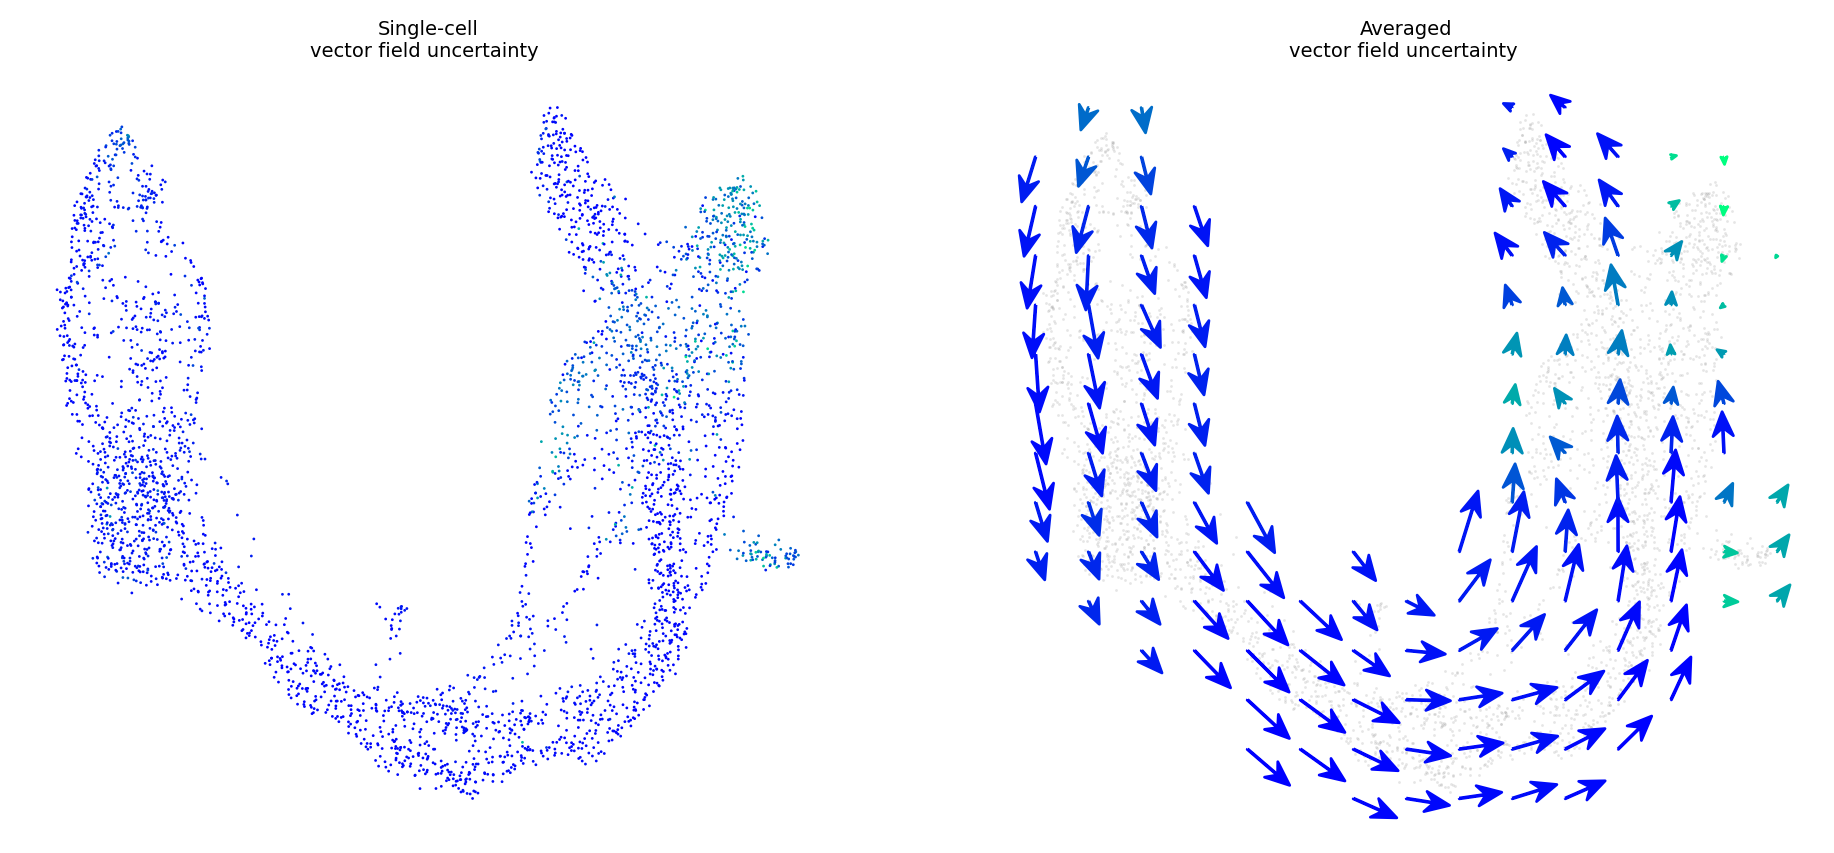
fig, ax = plt.subplots(1, 2)
fig.set_size_inches(11.5, 5)
plot_vector_field_uncertain(adata, embed_mean, embeds_radian,
                            ax=ax,
                            fig=fig, cbar=False, basis='umap', scale=0.05)
V_grid.........
60 50 40
More uncertainty evaluation metrics#
[15]:
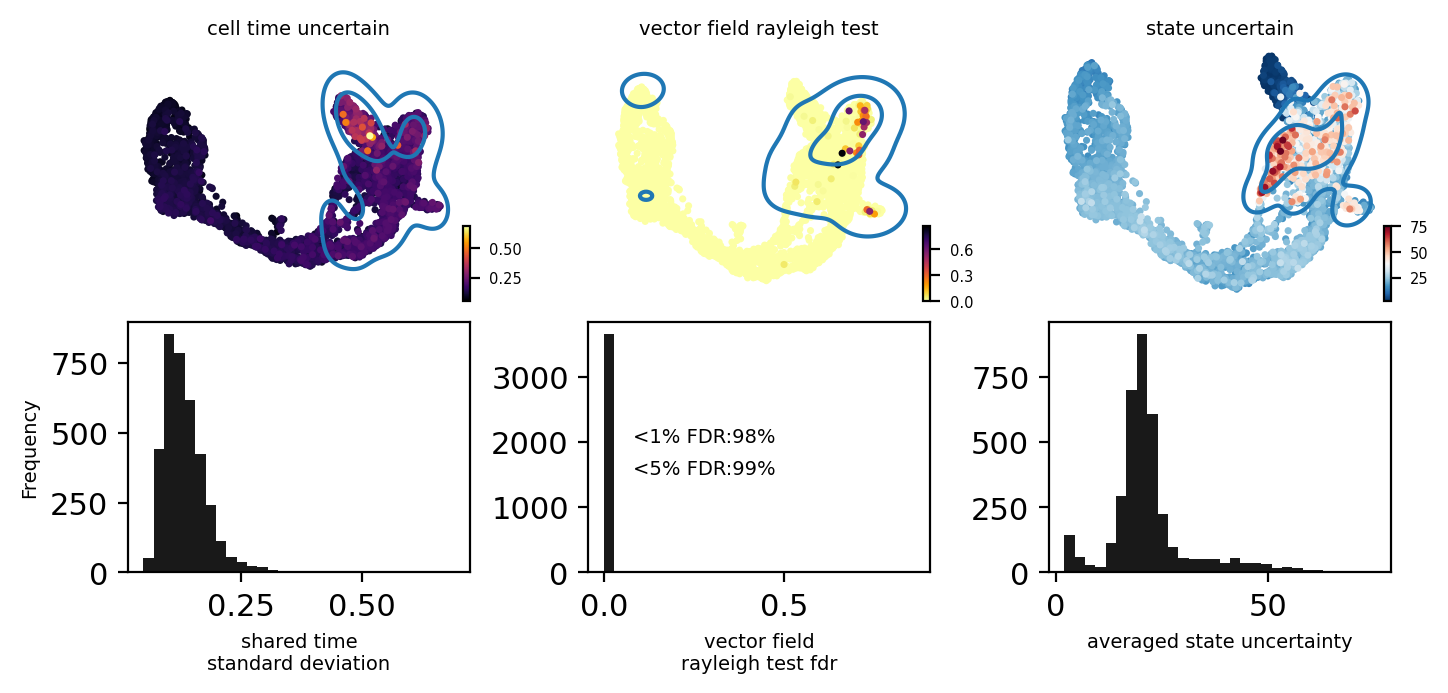
from pyrovelocity.plot import plot_state_uncertainty
fig, ax = plt.subplots(2, 3)
fig.set_size_inches(7.07, 3.5)
pos = adata_model_pos[1]
bin = 30
adata.obs['cell_time_uncertain'] = adata_model_pos[1]['cell_time'].std(0).flatten()
scv.pl.scatter(adata, c='cell_time_uncertain', ax=ax[0][0], show=False, cmap='inferno', fontsize=7)

_ = ax[1][0].hist(adata.obs.cell_time_uncertain, bins=bin, color='black', alpha=0.9)
ax[1][0].set_xlabel("shared time\nstandard deviation", fontsize=7)
select = adata.obs['cell_time_uncertain'] > np.quantile(adata.obs['cell_time_uncertain'], 0.9)
sns.kdeplot(adata.obsm['X_umap'][:, 0][select],
            adata.obsm['X_umap'][:, 1][select], ax=ax[0][0], levels=3, fill=False)

adata.obs['vector_field_rayleigh_test'] = fdri
scv.pl.scatter(adata, c='vector_field_rayleigh_test', ax=ax[0][1], show=False, cmap='inferno_r', fontsize=7)
select = adata.obs['vector_field_rayleigh_test'] > np.quantile(adata.obs['vector_field_rayleigh_test'], 0.9)
sns.kdeplot(adata.obsm['X_umap'][:, 0][select],
            adata.obsm['X_umap'][:, 1][select], ax=ax[0][1], levels=3, fill=False)

_ = ax[1][1].hist(adata.obs.vector_field_rayleigh_test, bins=bin, color='black', alpha=0.9)
ax[1][1].set_xlabel("vector field\nrayleigh test fdr", fontsize=7)
ax[1][1].text(0.08, 2000, "<1%% FDR:%s%%" % int((fdri < 0.01).sum()/fdri.shape[0]*100), fontsize=7)
ax[1][1].text(0.08, 1500, "<5%% FDR:%s%%" % int((fdri < 0.05).sum()/fdri.shape[0]*100), fontsize=7)

fig.subplots_adjust(hspace=0.3, wspace=0.7, left=0.01, right=0.8, top=0.92, bottom=0.17)
plot_state_uncertainty(pos, adata, kde=False, data='denoised', top_percentile=0.9, ax=ax[0][2])

_ = ax[1][2].hist(adata.obs['state_uncertain'], bins=bin, color='black', alpha=0.9)
ax[1][2].set_xlabel("averaged state uncertainty", fontsize=7)
select = adata.obs['state_uncertain'] > np.quantile(adata.obs['state_uncertain'], 0.9)
sns.kdeplot(adata.obsm['X_umap'][:, 0][select],
            adata.obsm['X_umap'][:, 1][select], ax=ax[0][2], levels=3, fill=False)

ax[1][0].set_ylabel("Frequency", fontsize=7)
fig.tight_layout()
[16]:
fig.savefig("pancreas_output_figure2.tif", facecolor=fig.get_facecolor(), bbox_inches='tight', edgecolor='none', dpi=300)